Asking About Advanced Stats
Everyone knows that one guy who sabotages friendly sports discussions by throwing out obscure stats and figures in a shameless attempt to prove how much smarter he is than everyone else.
Now, you can be that guy!
After discussing asking basic questions, we’re diving head-first into advanced stats.
(All stats included are accurate as of the date of publication. Results may have changed since then.)
Advanced Stats
For most fans, seeing which team has won the most games or which player has scored the most points is an adequate enough representation of success in the NBA. However, some people need stats that consider number of possessions, types of shots taken and a myriad of other factors that matter only to the truly obsessed. But, since the obsessed comprise the majority of our user base, we’ve made it possible to ask questions about advanced stats using simple, natural language.
Things that end in “rating”
Asking about offensive and defensive rating filters your results per 100 possessions since game flow and overtime can often affect game-level stats. For example, if you ask “Which team scored the most points in a game last season?” Detroit’s 147-point explosion in Chicago looks like the year’s best offensive performance. While that may be true based on total points, that game went to quadruple overtime, so the Pistons had 20 extra point-scoring minutes.
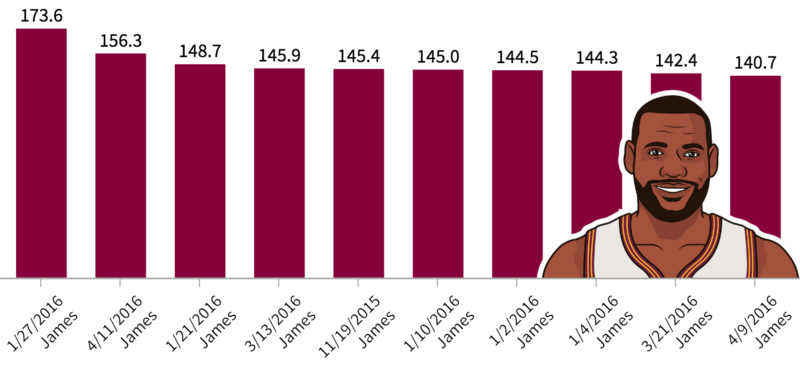
By asking using offensive rating (abbreviated as “ORTG”) rather than total points, you’ll see that the Cavaliers put up 122 points in a game with just 84.5 possessions for a season-high offensive rating of 144.3.
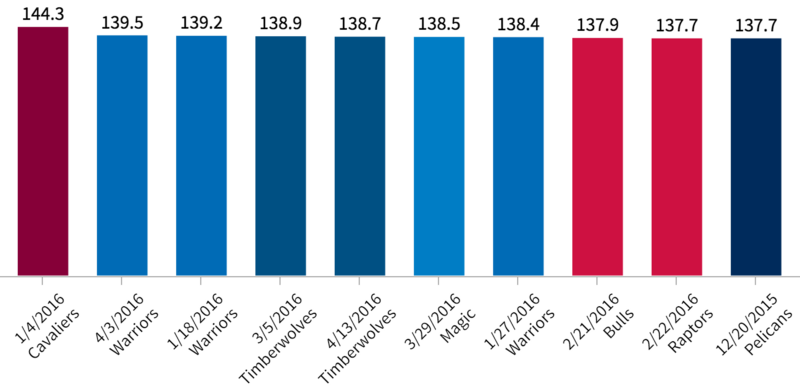
Similarly, defensive rating is calculated based on the number of points a team gives up per 100 possessions — the lower the number, the better the defense. Since we’ve already asked about the highest offensive rating in a game this season, let’s switch it up and look for the lowest defensive rating in a full season.
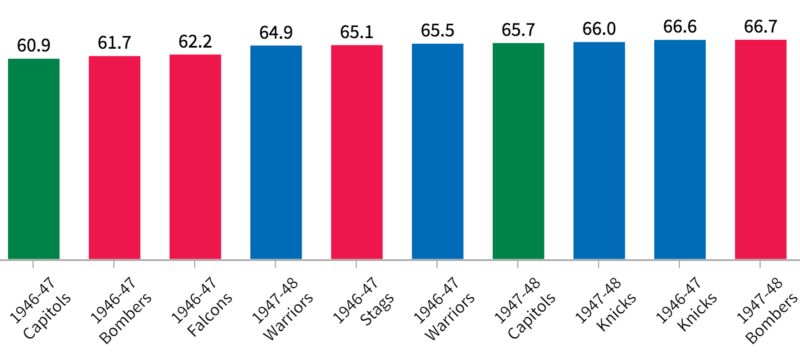
Since you’re not Ken Burns working on an expansive documentary, you probably don’t care how well the 1946–47 Chicago Stags (a real team) defended in the early, pre-Bill-Russell-era of pro basketball, so we’ll set a timeframe limitation to restrict results to the modern era:
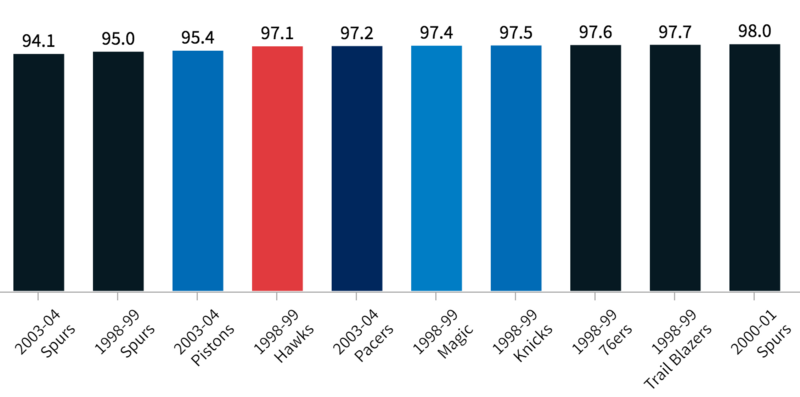
Here we see that based on defensive rating, the 2003–04 Spurs were the best defensive team of the last 30 years, followed two spots back by the 2003–04 Pistons, who actually won the championship that year — a fact you only remember when you see Chauncey Billups analyzing games on ESPN and wonder, “Didn’t he win a title?”
Offensive and defensive rating can also be applied to individual players to see who scores/allows the most points per 100 possessions. Or, you can filter based on minutes. A simple search will show us the league’s biggest scoring threat per 36 minutes:
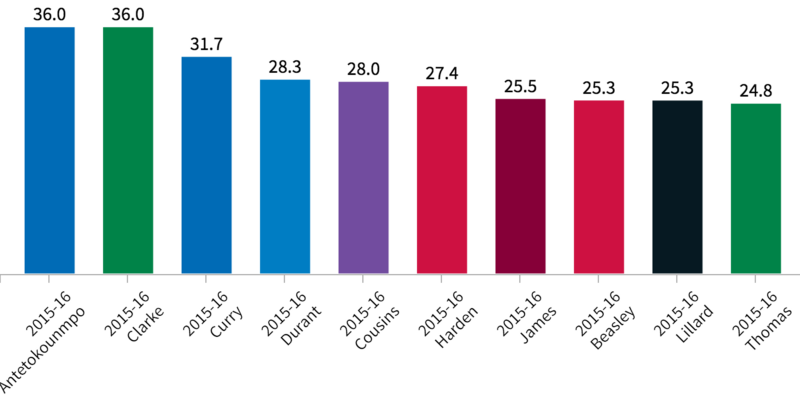
Thanasis Antetokounmpo and Coty Clarke. Just as you expected.
No offense to the either player, but scoring six points in exactly six minutes of playing time does not mean they’re both point-a-minute scoring threats. Thanasis isn’t even the best Antetokounmpo in the NBA. So, again, let’s use the knowledge we gained last week to set a minimum of 30 minutes per game:
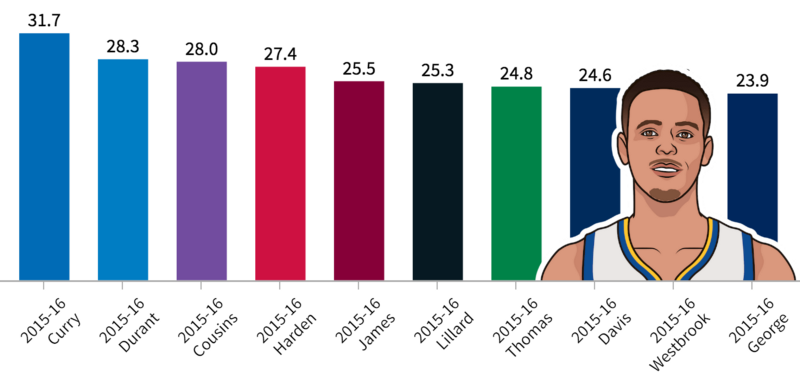
Curry, Durant, Cousins, Harden, etc. That’s more like it. Apologies to the other Greek Freak and to Coty Clarke, who StatMuse claims is an NBA player. If StatMuse says it, it must be true.
There’s no limitation to “per minute” searches. You can get literal and ask something like “Who scored the most points per minute for the Bucks last season? or go with the common “per 48 minutes” designation or even ask with any random number and get answers back.
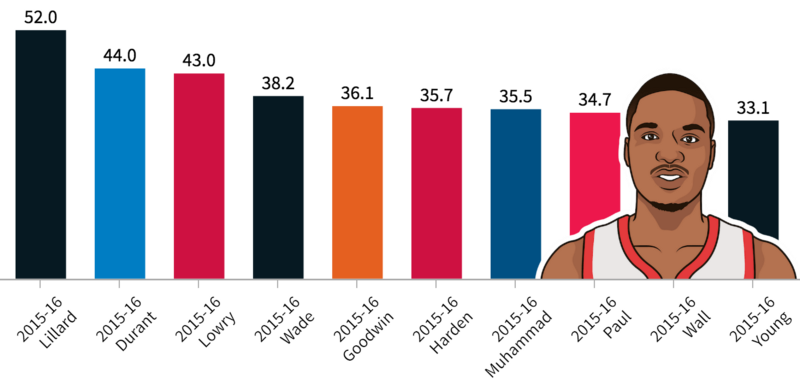
Things that end in “percentage”
It’s no coincidence that 7 of the top 10 instances of three-pointers attempted by a team in a season occurred in 2015–16. Some of the brightest minds in the league have used advanced statistics to calculate the long-term value of a three over practically any other shot outside the paint. Since players are attempting more of these lower percentage shots, the effective field goal percentage statistic was instituted to adjust for the three-pointer’s increased value. With StatMuse, a simple search can tell you which players’ values are more accurately portrayed with eFG% than FG%.
For example, in the last five seasons, the highest field goal percentages all belong to big men who get most of their buckets at point-blank range:
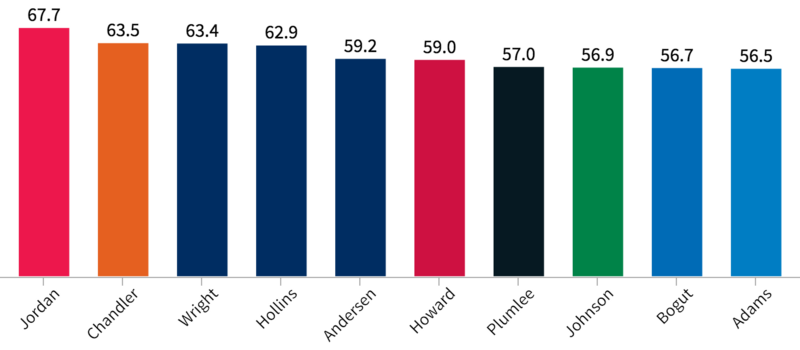
By adding an “e” in front of “FG%,” sharpshooters are given more credit for attempting more higher-value, lower-percentage shots:
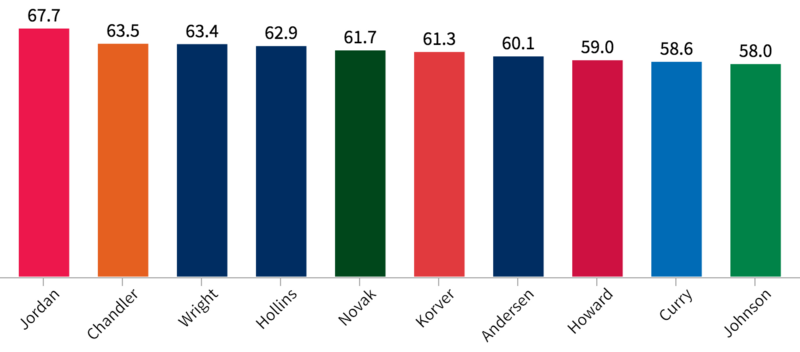
New additions to the list include Kyle Korver, Steve Novak and, of course, Stephen Curry.
You can also ask for usage percentage to see the percentage of a team’s plays a specific player used while he is on the floor (giving him a higher chance of contributing to the final box score).
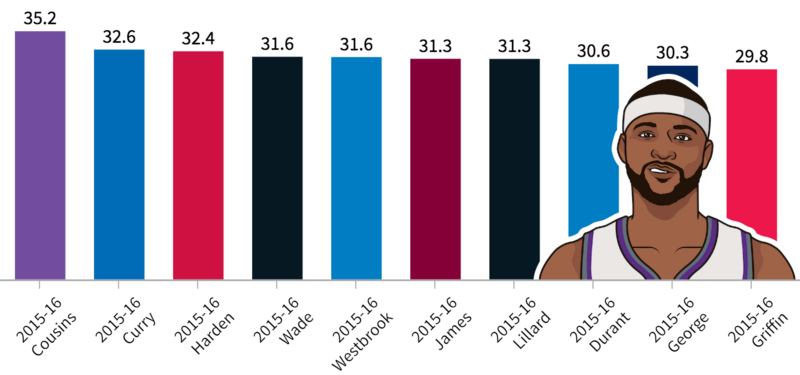
Other percentage-based advanced stats supported by StatMuse include offensive and defensive rebound percentage, with the latter being dominated by Andre Drummond since he came into the league.
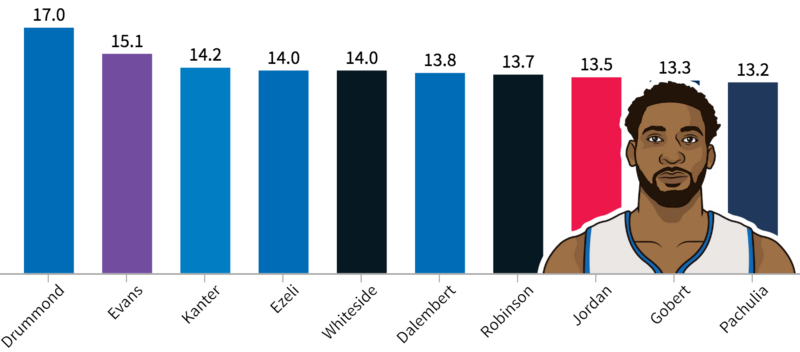
For a complete list of all the basic and advanced stats we support (and the appropriate abbreviations for each), check out our basketball statistics glossary.
StatMuse Basketball Statistics Glossary
A listing of basketball stats that are searchable on StatMuseblog.statmuse.com
Things that can be listed
Advanced stats can also be used to spice up basic questions. You can look at the top scoring performances of the last 5 seasons and supplement the data with true shooting percentage — a measure of shooting efficiency that takes into account 2-point field goals, 3-pointers and free throws.
Ask “Who scored the most points in a game in the last five seasons?” like usual, but then add “list TS%” to have the advanced stat added to the data table.
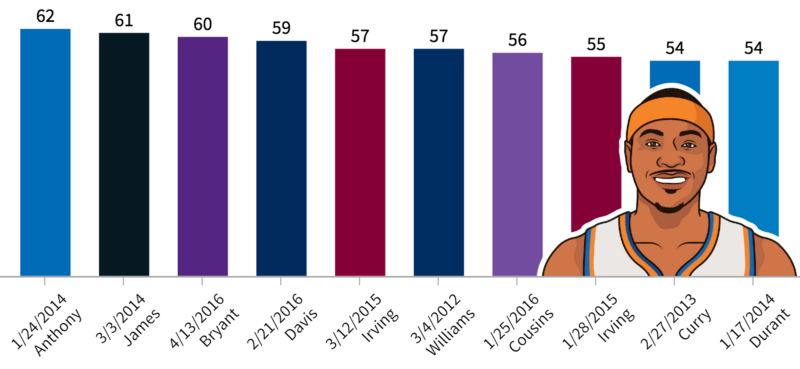
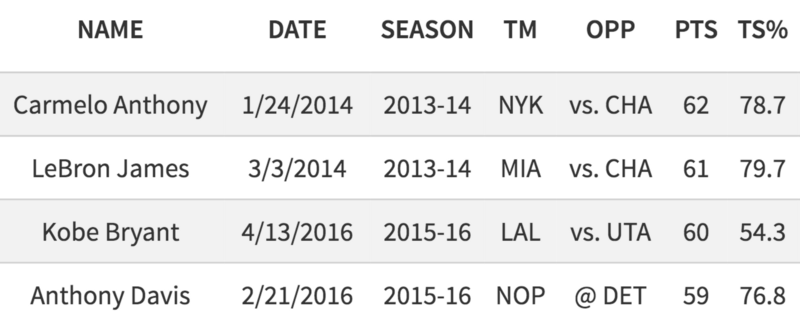
Any advanced or basic stats can be listed in a data table to help paint a fuller picture of a game, season or era (as long as the stat in question was tracked at the time). Get crazy with it and ask for an advanced stat and list every other advanced stat you can think of for a potent advanced stat cocktail.

Try It Yourself
Now that you’ve seen some of the advanced NBA questions you can ask StatMuse, it’s time to put your knowledge into practice. Log in to StatMuse and ask some of these questions yourself.
If you’re still not quite ready to ask your own questions, you can see some of the best ones shared recently on the homepage. If you need any help, click on the live chat icon in the bottom right-hand corner or send us a message on Twitter and we’ll help in any way we can.
Next, you’ll learn how to make pretty blue dots appear on your screen in a shot charts tutorial.

