Settling the debate: who’s the GOAT?
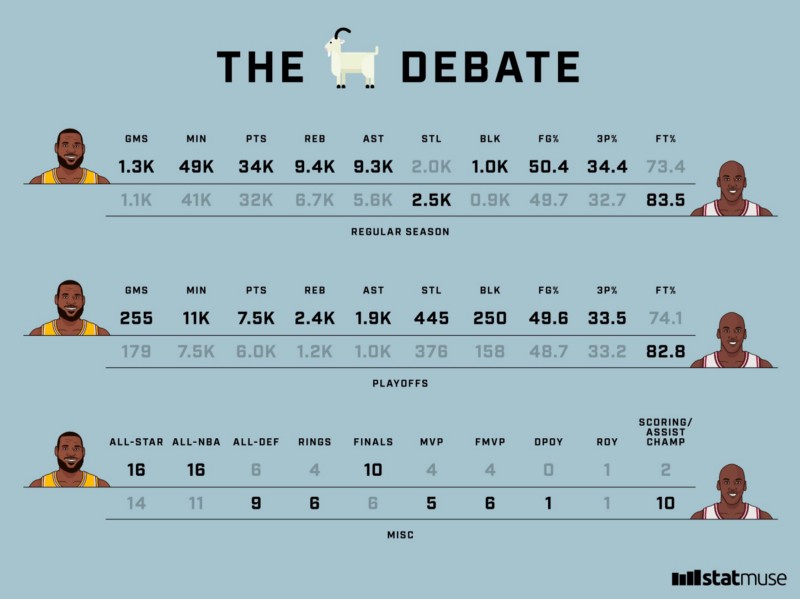
The graphic above looks at LeBron and Jordan’s total career stats. In summary, LeBron leads Jordan in every statistical category except steals in the regular season. Jordan tops LeBron in every single category for hardware (MVP, Finals MVP, rings, DPOY) except ROY which they both won.
Let’s look at their per game stats.
LeBron James career stats
27.1 PPG
7.4 RPG
7.4 APG
1.6 SPG
0.8 BPG
LeBron James career playoff stats
28.8 PPG
9.0 RPG
7.2 APG
1.7 SPG
1.0 BPG
172–88 record (.662)
LeBron James career Finals stats
28.4 PPG
10.2 RPG
7.8 APG
1.7 SPG
0.8 BPG
22–33 record in Finals games (.400)
Michael Jordan career stats
30.1 PPG
6.2 RPG
5.3 APG
2.3 SPG
0.8 BPG
Michael Jordan career playoff stats
33.4 PPG
6.4 RPG
5.7 APG
2.1 SPG
0.9 BPG
119–60 record (.665)
Michael Jordan career Finals stats
33.6 PPG
6.0 RPG
6.0 APG
1.8 SPG
0.7 BPG
24–11 record in Finals games (.686)
—
A couple of advance stats comparisons:
• LeBron has a 27.5 career PER, Jordan has a 27.9 career PER (second-highest and the highest PER of all-time, respectively)
• LeBron is a plus-6,839 and Jordan is a plus-1,438 in +/- in their careers (note: LeBron has played 7,541 more minutes than Jordan)
—
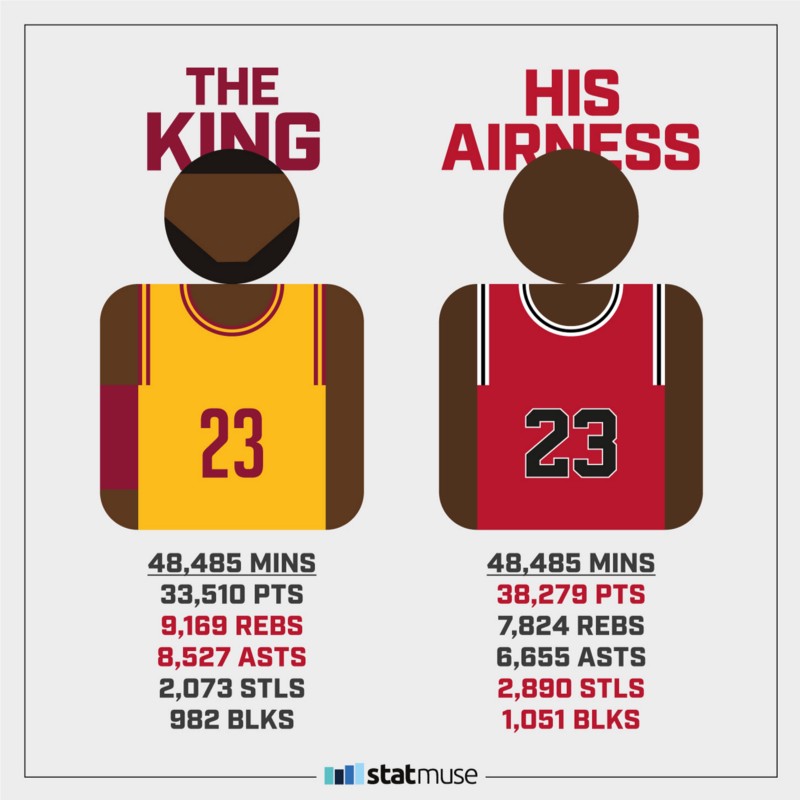
Another way to look at it: Jordan played 48,485 minutes in his career (regular season and playoffs). Let’s compare his total stats to LeBron’s first 48,485 career minutes (regular season and playoffs).
Tell us your who your GOAT is on Twitter @statmuse. Thanks for reading!
All stats were found via StatMuse and are accurate as of the date of publication.